My shop uses a lot of monitoring. In fact, just about every monitoring feature built into SQL Server we have tried, are using, or have plans to use in the near future. Some of the monitoring overlaps in purpose, and some of it steps on each others’ toes. We get useful data, but we’ve also discovered a lot of unexpected errors. One such issue was uncovered this month when we were updating servers to a new cumulative update.
A little background first
We use Collection Sets. A more obscure feature of SQL Server that you may have never even heard of. I admit, I did not remember that it existed before one of my colleagues suggested trying it. Collection sets essentially provide data audits and have helped us track down some anomalies in the past. The collection sets run nearly constant queries across all of our servers, then report back to the CMS to catalog the data. We’ve altered the jobs a bit, most importantly offsetting the collection set’s upload schedules to avoid latency and blocking issues.
Well, after installing a Cumulative Update this month, all of the collection sets broke. Failures started flowing in stating that the data uploads were not processing and our inboxes exploded. We had to figure out what the problem was and then fix over a hundred servers.
Error Message …Component name: DFT – Upload collection snapshot, Code: -1073450901, Subcomponent: SSIS.Pipeline, Description: “RFS – Read Current Upload Data” failed validation and returned validation status…
Solution The first step was to determine how to get the collection set jobs working correctly again. We had to stop each collection set, then stop any collection upload jobs that were still running.
Image may be NSFW. Clik here to view.
That alone wasn’t enough though, we had to then clear the cache files as well. These are stored in a folder on each server running the collection sets. You can find your cache location in the Object Explorer under Management -> Data Collection -> Right-click Properties.
Image may be NSFW. Clik here to view.
Deleting the cache seemed unnecessary to me at first, but when I tried skipping it, the collection still failed after restart.
We had to fix a lot of servers, and it would have taken hours to do this manually. So I scripted all the changes. I needed it done quickly because I was planning to get Korean food with a friend on the day of the break.
Scripts
You can do this all through PowerShell using Invoke-SqlCmd, but I find that process is very slow to make an initial connection, limits feedback, and I just needed this done fast.
The PowerShell code should run quickly as it will delete files from more than one server at a time. I included the computer name and run time as feedback so you don’t sit wondering how far along the script is. I had no feedback in my original script, so I sat fretting over how long it would take and how long I’d have to wait to go to lunch.
I'm not going to try to convince you in English not to use BETWEEN with dates. Run the code below to see why it's not a good idea. (Yes, I know there are new date types - this post isn't for you.)
-- Never use BETWEEN with dates.  Just use >= and -- Drop temp table.
if object_id('tempdb..#MyDates') is not null  drop table #MyDates-- Create a table of edge-case dates to demonstrate the issue.
create table #MyDates ( MyDate datetime not null)
insert #MyDates (MyDate) values ('2015-10-31 23:59:59.997')     -- October
insert #MyDates (MyDate) values ('2015-11-01 00:00:00.000')     -- November
insert #MyDates (MyDate) values ('2015-11-01 00:00:00.003')     -- November
insert #MyDates (MyDate) values ('2015-11-29 23:59:59.997')     -- November
insert #MyDates (MyDate) values ('2015-11-30 00:00:00.000')     -- November
insert #MyDates (MyDate) values ('2015-11-30 00:00:00.003')     -- November
insert #MyDates (MyDate) values ('2015-11-30 23:59:59.997')     -- November
insert #MyDates (MyDate) values ('2015-12-01 00:00:00.000')     -- December -- (1)  Now let's get all the November dates using BETWEEN. -- We want to get 6 rows back, but this returns 4!  Notice '2015-11-30 00:00:00.003' and -- '2015-11-30 23:59:59.997' are missing from the results.
select MyDate as '(1)' from #MyDates where MyDate between '2015-11-01' and '2015-11-30' order by MyDate   -- This is WRONG - do not use! -- (2)  Okay, that didn't work, so let's try extending out an extra day. -- We want to get 6 rows back, but this returns 7!  Notice '2015-12-01 00:00:00.000' is -- included in the results, but we only want November.
select MyDate as '(2)' from #MyDates where MyDate between '2015-11-01' and '2015-12-01' order by MyDate   -- This is WRONG - do not use! -- (3)  Hmmm, let't try going up to the last second of the last day of November. -- We want to get 6 rows back, but this returns 5!  Notice '2015-11-30 23:59:59.997' -- is missing from the results, because it occurs *inside* that last second of November.
select MyDate as '(3)' from #MyDates where MyDate between '2015-11-01' and '2015-11-30 23:59:59' order by MyDate   -- This is WRONG - do not use! -- (4)  So how *does* one use BETWEEN with dates correctly?  This is the only way. -- (Why 997?  Google for "sql server datetime 997" for more info.)
select MyDate as '(4)' from #MyDates where MyDate between '2015-11-01' and '2015-11-30 23:59:59.997' order by MyDate   -- This is CORRECT! -- (5)  But who wants to type all that out?  Instead of using BETWEEN, do it this way.
select MyDate as '(5)' from #MyDates where MyDate >= '2015-11-01' and MyDate -- This is CORRECT! -- Drop temp table.
if object_id('tempdb..#MyDates') is not null  drop table #MyDates
Last year I participated in the first Data Field Day in San Jose. I’m honoured to be a delegate for the tenth Tech Field Day which follows the same format. On 3-5 February I’ll be in Austin, Texas visiting with vendors in the software, hardware and virtualization world. There will be twelve of us participating, along with our fearless host, Stephen Foskett ( @SFoskett ).
At each vendor visit there will be livestreaming during their presentation and we will discuss their products and services, ask questions. You can follow that stream above. Delegates are known for their brutal honesty, their insight and even some fun observations.
You can also follow along on Twitter hashtag of #TFD10. You can also post your own questions for these session using that hashtag.
What I love about field days is the the mix of delegates with a wide background in business, tech, innovation, entrepreneurship and data. This breadth means that we, as a team, look at the technology and business with a variety of viewpoints. And you get to watch it all live.
BTW, the next Data Field Day is scheduled for 8-10 June. If you have products or services you’d like to present to a team of independent data experts, contact me.
I hope you can follow along. It’s a great chance to see real world tech innovation discussions.
It’s been a while since I’ve posted as the run up to Xmas last year and this January have been particularly busy. February doesn’t seem to be going to be any quieter but at least I’m being kept on my toes.
Anyway, waaaay back in December the SQL Server Ireland User Group (website) ran a Xmas “extravaganza” in which they held a series of lightening talks. Presenting is something that I’ve wanted to get into for a while so with a bit of pushing from one of the guys on the panel, I signed myself up. The talk only needed to be 5 minutes long but this was ideal for me considering I’ve never presented before.
The talk I did was on how I implemented partitioning on a set of existing tables within my company’s OLTP databases. First time presenting? Stick with something you know. I also felt pretty safe from awkward questions (or people pointing out how I could have implemented the solution more effectively!) as I wanted the session to be very specific to the environment I was working with and the limitations/restrictions I had to deal with.
So how did I do? Well considering I was quite convinced that I was going to stammer, freeze up and then flee the room (honestly, I thought this WAS what was going to happen)…quite well really. I did have a minor technical glitch…I was duplicating my desktop onto the projected screen and it started reverting back to extend (as I have it in the office), so the screen on the projector went blank. Not a problem at first as this happened when I was setting up so I quickly went into settings and set it back to duplicate.
However, I did this too quickly and forgot to click the “Keep Changes” option so after 10 seconds it reverted and the screen went blank again. So I went back into the settings, fixed it, forgot to click “Keep Changes” and ended up in this loop until one of the other presenters helped me out (thankfully). In the end I managed to laugh it off, continue and ended up winning a bottle of champagne for “Best New Speaker” so I’m not going to obsess about that too much (I promise).
In the end I really enjoyed the whole experience…OK…looking back with rose tinted glasses I enjoyed it, at the time I was too nervous. I’m not going to turn this post into another “Best pieces of advice for first time presenters” (although I can’t promise I won’t do one of those posts in the future) but one thing I will say is know, really know your presentation. Go over it over and over, practice continuing when making mistakes and don’t stick to a rigid script. By this I mean, if you go off track slightly, you’ll be able to make it through without stumbling over or losing track.
So what now? Well I’ve been accepted to present another lightening talk at SQL Saturday Exeter. It’s only 10 minutes I know but it’s double what I’ve done previously and the SQL Saturday events are much bigger. I’ll post about how it went afterwards but for now I’m looking forward to it, until the panic sets in!
This is a temporary post that was not deleted. Please delete this manually. (4dac2d12-7ef4-46ee-8232-23419095b3d8 – 3bfe001a-32de-4114-a6b4-4005b770f6d7)
Image may be NSFW. Clik here to view.Image may be NSFW. Clik here to view.Image may be NSFW. Clik here to view.Image may be NSFW. Clik here to view.
One of the cool things that was added a few years back was the Central Management Servers feature. It was introduced in the Standard and Enterprise editions of SQL Server 2008. This feature helps DBAs to maintain multiple SQL Server instances across an enterprise environment and provides two major benefits when multiple SQL Server instances need to be affected by a specific action:
An execution of a specific T-SQL query against SQL Server instances registered within Central Management Servers
An evaluation of a set of policies on SQL Server instances registered within Central Management Servers.
After you create a central management server, you can execute queries against a whole group (single or multiple server groups) at the same time and one (or more) registered servers. Using SQL Server Management Studio, this is how you can create a central management server. (I will also show you how to add one or more server groups to the central management server and add one or more registered servers to the server groups)
Create a central management server
In SQL Server Management Studio, on the View menu, click Registered Servers.
Image may be NSFW. Clik here to view.
In Registered Servers, expand Database Engine, right-click Central Management Servers, and then click Register Central Management Server.
Image may be NSFW. Clik here to view.
In the New Server Registration dialog box, select the instance of SQL Server that you want to become the central management server from the drop-down list of servers. You must use Windows Authentication for the central management server.
Image may be NSFW. Clik here to view.
In Registered Server, enter a server name and optional description.
Image may be NSFW. Clik here to view.
From the Connection Properties tab, review or modify the network and connection properties. For more information, see Connect to Server (Connection Properties Page) Database Engine
Click Test, to test the connection.
Image may be NSFW. Clik here to view.
Click Save. The instance of SQL Server will appear under the Central Management Servers folder.
Image may be NSFW. Clik here to view.
Create a new server group and add servers to the group
From Registered Servers, expand Central Management Servers. Right-click the instance of SQL Server added in the procedure above and select New Server Group.
Image may be NSFW. Clik here to view.
In New Server Group Properties, enter a group name and optional description.
Image may be NSFW. Clik here to view.
From Registered Servers, right-click the server group and click New Server Registration.
Image may be NSFW. Clik here to view.
From New Server Registration, select an instance of SQL Server. Click Test, to test the connection and then Click Save.
Image may be NSFW. Clik here to view.
The instance of SQL Server will appear under the Central Management Servers folder. Add more servers as appropriate.
Image may be NSFW. Clik here to view.
Now you can execute queries against the whole group
We use SQL Server Integration Services (SSIS) for all of our data movement and upgrades. Recently, when running a particular SSIS package, one of our new servers threw a strange error:
“There was an exception while loading Script Task from XML: System.IO.FileNotFoundException: Could not load file or assembly ‘Microsoft.VisualStudio.Tools.Applications.Core’“
I was on call and one of the first things I did was to cover the basics – checking out the environment. The SSIS package file (.dtsx) was located on the file system exactly where I had expected it to be and hence, I was stumped to see the “File Not Found” exception. The strange thing was that the same package worked fine when run on the staging environment and also in my local development environment.
After checking out various things and a break, I refocused my attention to reading the error message again. That’s when the words simply popped out at me – “…while loading Script Task from XML…” – the script task is where the problem was. Script tasks are most commonly used to set connections on the connection managers and that’s exactly what we were doing.
The problem
Script tasks in SSIS leverage the Visual Studio Tools For Automation (VSTA). I therefore headed over to Add/Remove Programs to confirm that VSTA is indeed installed. I only had the 64-bit version installed on the affected server. As with all things SSIS, on a 64-bit system, I had expected to see both the x64 and the x86 version of VSTA installed. Below is a screenshot of the Add/Remove programs from one of my test VMs which is a 32-bit environment (I could not get the actual screenshot because it was a production server).
Image may be NSFW. Clik here to view.
Sample VSTA installation on a 32-bit environment (non-production)
The Solution
I immediately contacted the on-call IT team, who kindly shared the SQL Server media from which the installation was done. Just navigating to the following path on the media gave me the 32-bit installable for VSTA. We installed 32-bit version of VSTA and the issue was resolved.
Path on the SQL Server media to get VSTA: ..\redist\VSTA\runtime\x86
Have you ever encountered this or other interesting issues in your deployment experience? How did you troubleshoot them? Do share via the blog comments – I would love to know!
I see TempDB using more memory than I feel it should and found a way to resolve it. Previously I dove into technical details and questioning what I saw in my post TempDB Memory Leak? which is great for proving and debugging an issue. Now I want to step back and talk about it from a practical perspective.
To keep it practical, I’m going to walk through a single server, step-by-step. What I saw that caught my eye and how I applied my workaround. This is a real, production server with screen shots from Idera Diagnostic Manager for both before and after comparisons.
What I’m Seeing
A large portion of my buffer pool is being utilized by TempDB pages which are unallocated on disk. The easiest way to see this is this quick query:
SELECT Unallocated_MB = COUNT(1)/128FROM sys.dm_os_buffer_descriptors bdLEFT JOIN sys.allocation_units au ON bd.allocation_unit_id = au.allocation_unit_idWHERE bd.database_id = 2AND au.allocation_unit_id IS NULL
Since these are all pointing to real, but unallocated TempDB pages on disk, I was able to develop a workaround of simply having fewer TempDB pages on disk. AKA, I made TempDB data files smaller.
Sizing TempDB
Here we’re talking about being hurt by TempDB being too large, but we can’t lose sight of TempDB being too small hurting you as well. Specifically, when your server is the busiest with a small TempDB it will have to stop and grow the files, then deal with any fragmentation that process caused. So, while I’m not going to recommend filling your dedicated drive, I’m not going to recommend making TempDB tiny, either.
My recommendation is to monitor your server, find out how much space TempDB uses, and make your TempDB significantly larger than that. The longer you have watched your server, the better. The goal is still to avoid almost any growth possible, but I’m adding in a “don’t go crazy” clause.
You can do this yourself as I talked about in Monitoring Database and Table Sizes using the function call FileProperty(<filename>, ‘space used’). If you do it this way, make sure you have this running for a minimum of several weeks at least once an hour, day and night. It’s possible, not difficult to do, and not recommended for servers that have a reasonable monitoring system already in place.
If you’re doing this to your production servers you should already have monitoring software that’s watching file sizes for you, even if it’s only tracking this in the background with no obvious way to find the information in the GUI. This is the situation I find myself in using Idera Diagnostic Manager. The data’s there, but the GUI is set up for more immediate concerns. I need this query to get what I want out of it.
SELECT TOP 100 S.InstanceName, DS.UTCCollectionDateTime, D.DatabaseName , DataUsed_GB = CAST((DataSizeInKilobytes + IndexSizeInKilobytes) / 1024 / 1024.0 AS DEC(20,1))
	, LogUsed_GB = CAST(LogSizeInKilobytes / 1024 / 1024.0 AS DEC(20,1))FROM SQLdmRepository.dbo.DatabaseSize DSINNER JOIN SQLdmRepository.dbo.SQLServerDatabaseNames D ON DS.DatabaseID = D.DatabaseIDINNER JOIN SQLdmRepository.dbo.MonitoredSQLServers S ON S.SQLServerID = D.SQLServerID WHERE UPPER(S.InstanceName) = 'SERVER\INSTANCE'  AND D.DatabaseName = 'tempdb'AND UTCCollectionDateTime > GetUTCDate()-180ORDER BY 4 DESC
My recommendation is to take the peak size outside of a one-time process and make the total TempDB data files at least 150% of that size. If you have 4 TempDB data files and the peak size used is 4 GB, 150% of that is 6 GB, so make each file at least 1.5 GB. Then set autogrowth to something reasonable because one-time processes will happen.
My Before Observations
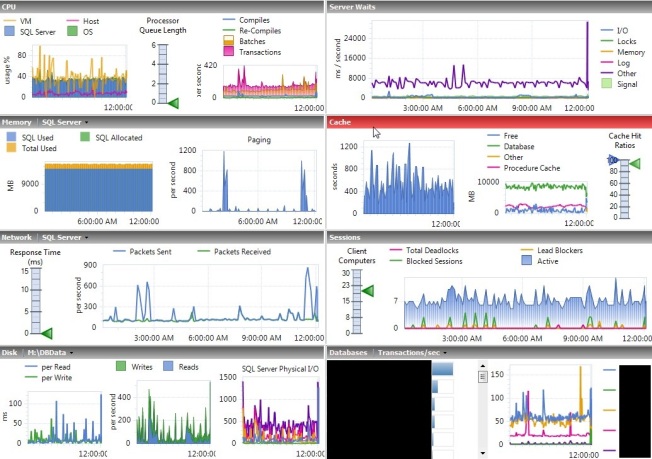
All of the screen shots and trending information are from Idera Diagnostic Manger, but you should be able to get the same basic information out of any monitoring software.
I had a server with rather low PLE and a lot of physical I/O.
Image may be NSFW. Clik here to view.
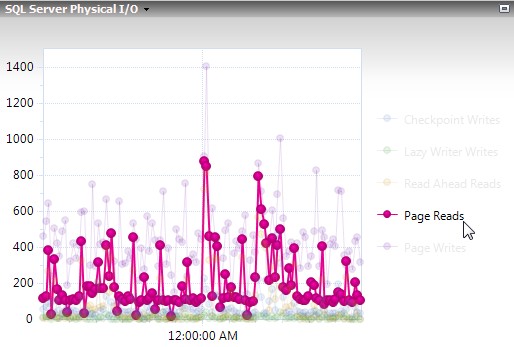
The physical I/O is difficult to see here because this server has a lot of writes. When you look closer you can see that it rather regularly went to 400 page reads per second.
Image may be NSFW. Clik here to view.
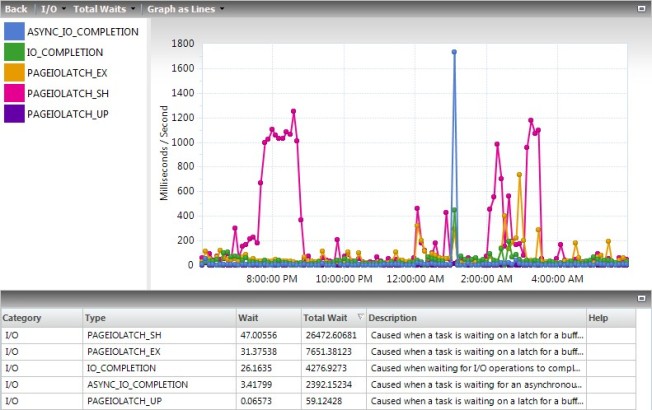
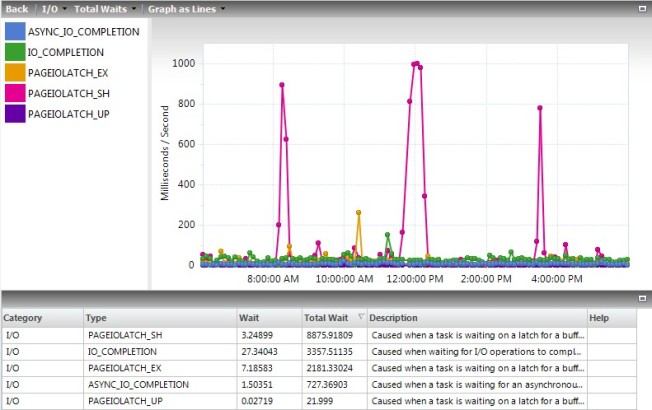
All of those reads caused lots of waits on the server. In my 12-hour sample period I saw a total of 34,000. The units shown for this field are fine for comparison reasons, but they appear to be a total of the ms/s on the chart for values collected every 6 minutes, not the total waits. You have to query the tables behind Idera Diagnostic Manager to get the real values. In this case, the total waits were 138 minutes for shared and 49 for exclusive latches, for a total of 187 minutes of waiting for the 12 hours.
Image may be NSFW. Clik here to view.
Just seeing this I wanted to request more memory on the VM, after all it only had 16 GB. However, I made it a rule to never add memory without justifying what’s in memory first. To do that, I used my query on Query the Buffer Pool, and this was the first line in the results:
Image may be NSFW. Clik here to view.
Of the 8.5 GB of memory used by the buffer pool, about 6 GB of that was used by unallocated space in TempDB. I can accept some because of how TempDB caches temp tables and other stuff, but to have 70% of the buffer pool used up while I’m seeing low PLE and high I/O is not acceptable.
My Fix
I had the files set to practically fill the dedicated drive according to best practices, so each of the 4 files was 7,000 MB adding up to almost 28 GB on a 30 GB drive.
Using the query in the Sizing TempDB section above, this server has never used more than 1 GB of data in TempDB at one time. While that makes for some interesting questions on how it’s using 6 GB of cache, it does give me a lot of room to reduce the size.
There were no complaints about performance due to what this server is being used for, so I didn’t try to shrink TempDB. Instead I took the patient approach an resized TempDB, which took effect the next time SQL Services restarted. Then I waited for our scheduled server reboots for Windows Updates.
Note that my recommendation above would have been to make the files at least 1.5 GB and I made them 2 GB here. I’m not worried about exact numbers, I’m worried about being reasonable sizes that also avoid growths. With peak observed usage at 1 GB and TempDB sized at 2 GB, any growths should be very rare.
Overall, the data files will grow at 512 MB at a time, which, when it happens, is large enough to avoid extreme fragmentation yet small enough to avoid extreme waits. This should only happen during “I didn’t mean to do that” or “how’d it get that execution plan” moments, but it will happen.
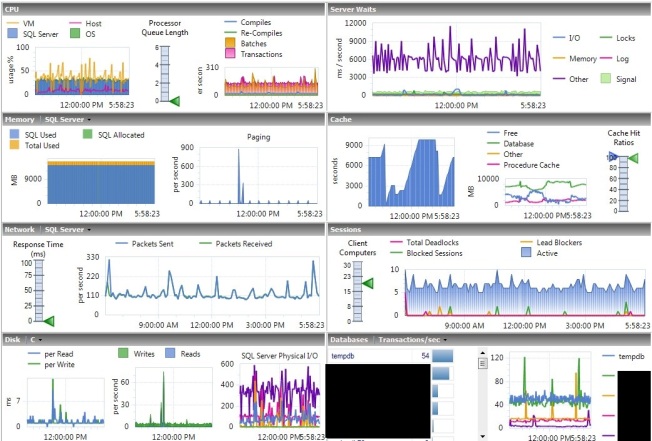
My After Observations
After the change I waited a couple days to let the cache stabilize after a reboot. We rebooted on Saturday, and all of these numbers are from the Tuesday after.
When I looked again, TempDB was using 1/10 of the space it was before for unallocated pages in memory. It’s not perfect, but it’s much better.
Image may be NSFW. Clik here to view.
TempDB using less cache allowed PLE be a lot more stable, regularly staying well above 2,000. Using Jonathan Kehayias’s formula, PLE should be above 1,050 on a server with 14 GB of cache, so this is looking good.
Image may be NSFW. Clik here to view.
With data staying in cache more, physical I/O also dropped. Before it was normal to see spikes to 400 page reads per second, now you’re seeing about half of that.
Image may be NSFW. Clik here to view.
Less activity also meant less waits. The couple spikes still went almost as high, but those are things you’ll fix more through tuning than memory management. The totals at the bottom are what I’m focused on right now, the PageIOLatch_xx waits combined added up to about 11,000 for the day, so about 1/3 of what it was before.
Again, I don’t like how Idera Diagnostic Manager calculates the totals. When I queried the tables I saw that there was 60 minutes of waits on shared latches and 13 minutes on exclusive latches, for a total of 73 minutes. This is in comparison to 138 + 49 = 187 minutes before.
Image may be NSFW. Clik here to view.
The Downside
Even with the new, smaller size, TempDB is a lot larger than it needs to be so it would be very rare to see any growths in the near future. However, I have to keep in mind that the load on my servers will always be increasing, so I may end up hitting autogrowth down the road. Then I’ll reboot the servers each month with Windows Updates, it’ll shrink TempDB back down for me, and it will have to grow again the next month.
Because of this, I’ll need to visit every one of my servers from time to time (semi-annually?) to see if this is occurring and increase the size of TempDB if it is. I’ll use the same script for determining the peak sizes because I have software that’s capturing that already, but I could find other methods to get that information if I needed to.
The only other downside I see is with servers that hit a high peak TempDB usage overnight then never come close to it again during the day. This workaround won’t do much for those servers. You need that space overnight, so trying to make the size smaller than what it needs at 2 AM will just make everything worse. However, knowing about this will drive you nuts enough to look into the overnight processes to see if you can lower peak usage. Perhaps you can spread out some concurrent tasks or tune some bad queries that never mattered due to their timing. It’s not a bad thing to do this work, it’s just that this probably wasn’t a good time for something to climb up your priority list.
Take a Look
Take a look at your servers. How much cache is TempDB using? Does TempDB ever even use half of the space allocated to it? Is it causing issues on your servers?
Never make a change just because you saw someone say it’s a good idea, especially if they’ve never seen your servers before. Look at the numbers on your servers for yourself, ask questions to understand it, and make the best decision for those specific servers.
If you do make this change, check TempDB before your next reboot. Did it have to grow? If it did, you need to change the size manually so it doesn’t have to hit an autogrowth every month. If you shrunk it down to 2 GB total then it grew to 2.5 GB, consider making it 3.5 GB to avoid future growths while keeping the files reasonably sized.
Configuration option ‘scan for startup procs’ changed from 0 to 1. Run the RECONFIGURE statement to install.
There is no reason to run RECONFIGURE since it won’t be used until after the next reboot anyway. Now that the system will actually use our startup SP we can create the SP we want and mark it to be run on startup.
I’m using some code of Aaron Bertrand’s (b/t) that I found in this question on Stack Overflow and modified it to suit my needs here.
CREATE PROCEDURE sp_AgentStartup AS
DECLARE @agent NVARCHAR(512);

SELECT @agent = COALESCE(N'SQLAgent$' + CONVERT(SYSNAME, SERVERPROPERTY('InstanceName')),
  N'SQLServerAgent');

CREATE TABLE #QueryState (CurrentServiceState varchar(20))

INSERT INTO #QueryState
EXEC master.dbo.xp_servicecontrol 'QueryState', @agent;

IF EXISTS (SELECT 1 FROM #QueryState WHERE CurrentServiceState = 'Stopped.')
	EXEC master.dbo.xp_servicecontrol 'Start', @agent;
GO
EXEC sp_procoption 'sp_AgentStartup','startup','on'
GO
sp_procoption is a system stored procedure that lets us change the options on a stored procedure and in this case set it to run on startup. Note: The account that is running SQL Server needs to have permissions to start the Agent service. (Or do whatever your startup stored procedure does.) You can have as many stored procedures running on startup as you want but remember the more you have the longer it’s going to take for your instance to start.
Run job on startup of the Agent
Ok, now that the Agent is started, if we have something more complicated we want to run, we can tell a job to run on startup. (Startup of the Agent.) It’s really pretty easy though. It’s just a matter of creating a schedule with a schedule type of Start automatically when SQL Server Agent starts.
Experienced Analysis Services and Power Pivot developers will know all the interesting things you can learn from DMV queries. For example, in this blog post Kasper de Jonge shows how to use a DMV to find out which columns are using the most memory in a Power Pivot model; here’s an older post from me on using DMVs to show the dependencies between DAX calculations. There’s plenty of other interesting stuff about how data is stored and so on that you can find with a bit of digging, and there’s some reasonably up-to-date documentation on DMVs for SSAS here.
However, running DMV queries against a Power BI Desktop model (which of course runs a local version of the same engine that powers Analysis Services Tabular and Power Pivot) and more importantly doing something useful with the information they return, isn’t straightforward. You can run DMV queries from DAX Studio but that will only give you the table of data returned; you need to copy and paste that data out to another tool to be able to analyse this data. Instead it’s possible to use Power BI Desktop’s own functionality for connecting to Analysis Services to connect to its own local data model and run DMV queries.
If you’re connecting to an instance of Analysis Services in Power BI Desktop you need a server name and a database name and the same goes when you’re connecting Power BI Desktop to itself. This episode of Adam Saxton’s excellent Guy In A Cube YouTube show details how to connect SQL Server Profiler to Power BI Desktop in order to run a trace, and the method he uses to find the connection details also works for our purpose here; it’s definitely worth a watch because it goes into a lot of detail. However it’s much easier to get the connection details from DAX Studio using the following steps (thanks to Darren Gosbell for pointing this out):
Open Power BI Desktop and load data as normal.
Open DAX Studio and choose the Power BI Designer data source option:
Look in the bottom right-hand corner of the screen and you’ll see the server name, including the all-important port number, that you have connected to. In this case it’s localhost:52981
Now go back to Power BI Desktop, click the Get Data button and choose Analysis Services. In the connection dialog enter just the server name and port number and the database name found in the previous steps, as well as your DMV query:
Once you have done this, you can load the results of your DMV query into the data model and analyse the results just like any other data. Here’s an M query using the DMV from the blog post by Kasper referenced earlier that looks at the memory used by just one table in the model:
let
    Source = AnalysisServices.Database("localhost:52981", "1107a5df-3dd9-4c16-80b6-cf571c4e794f",
     [Query="SELECT dimension_name, attribute_name, DataType,
                   (dictionary_size/1024) AS dictionary_size
                   FROM $system.DISCOVER_STORAGE_TABLE_COLUMNS"]),
    #"Filtered Rows" = Table.SelectRows(Source,
     each ([dimension_name] = "FactInternetSales"))
in
    #"Filtered Rows"
And here’s a bar chart built from that query showing clearly that the SalesOrderNumber column in the FactInternetSales table is very expensive:
Before you get too excited about this, there are two major problems you need to be aware of when using this technique:
The port number used to connect to the local data model and the database name will change every time you open the Power BI Desktop file, so you will have to edit the connection information manually if you want to refresh the data after reopening.
You won’t be able to make this connection refresh once you have published the file to PowerBI.com – so this will only work on the desktop.
That said, I think this is still very useful for development purposes. At some point I expect we’ll probably get a range of management reports in PowerBI.com that show similar data on published reports – just like we used to have in the old Office 365 Power BI.
I had so many more questions I wanted to talk about during my recent State of the Union of Data Modeling 2016, but one hour goes by quickly when you have tools, industry, professionals, standards and user groups to cover. I’m interested in your observations and comments about these questions:
Has data modeling accomplished all it needs to? Are we just in the maintenance phase of data modeling as a practice and profession?
What industry trends (tools, processes, methods, economics, whatever) are impacting (positive or negative) data modeling the most today?
How has the cost of data modeling changed since 1980s?
How has the return on data modeling changed since the 1980s?
How has risk changed in data modeling since the 1980s?
Data Modeling tools have so much maturity of features in them today. But along with that prices have reflected those changes. How have the prices of enterprise data modeling tools impacted data modeling on enterprise projects?
Have you worked with any non-IDEF1x/IE data modeling notation recently?
Have you worked with any open source data modeling tools?
What new features/enhancements/changes would you like to see in data modeling tools? Processes? Notations?
Why haven’t we solved the “no one loves me or my models” problem more widely?
I’ll add my thoughts on these in the comments, but I’d like to hear your responses as well.
Image may be NSFW. Clik here to view.It’s Monday and time fora round-up of last week’s blog and twitter activity – and even an on-time post for all of this. If you haven’t already, follow me on twitter (@StrateSQL). This is a good chance to catch up on data platform technology and career related information I’ve shared in the last week and activity on this blog.
Most Popular Article Shared
Last weeks most popular link is an article by Aaron Bertrand (@AaronBertrand) on SQLPerformance.com. Something wonky happened to the link since I wrote my original tweet, so if you are looking for the article, there’s a new link – SQL Server 2016 : In-Memory OLTP Enhancements. If you are looking at SQL Server 2016, you should also check out this post.
Along with the most popular link, here are the top twenty items relating to SQL Server, technology and careers that were shared last week. If you missed them throughout the week, here’s the opportunity to get caught up on some items that other’s read after I linked them out.
Sometimes the most useful content on a blog wasn’t written in the past week, it’s often other articles shared in the past that resonate with readers. Check out the following links that I published in past years over the past week:
Microsoft made available the first technical preview of its new Microsoft Azure Stack offering today. It was announced last week. Azure Stack brings the cloud model of computing to every datacenter – your own private cloud. Azure Stack is a new hybrid cloud platform product that enables organizations to deliver Azure services from their own datacenter in a way that is consistent with Azure. You can download it now, but first check out the hardware and deployment requirements. Once installed, check out the Tools and PaaS services for Azure Stack which will be updated frequently. If you run into any issues and need help, or if you’d like to provide feedback or make requests, visit the Azure Stack forum.
Also released is a whitepaper providing more information on key Azure Stack concepts and capabilities that should help you gain a much richer understanding of Microsoft’s approach. Check out the full documentation.
On February 3, Mark Russinovich and Jeffrey Snover will discuss and demonstrate Azure Stack in a webcast, followed by a question and answer session.
Azure Stack essentially is Microsoft’s better bridge to using its cloud services, both the platform-as-a-service (PaaS) and infrastructure-as-a-service (IaaS) kinds. It uses the same code as Azure. Scripting tools for management, such as PowerShell and command-line interfaces, will work across Microsoft’s Azure cloud computing services as well as local datacenter implementations of Azure Stack. This allows a company to build a private cloud, and then easily migrate parts to a public cloud, allowing you to have a true hybrid cloud platform. Microsoft is the only company to have both a private and public cloud option.
General availability is scheduled for Q4 of this year, but some services will only be in preview at that time:
Last time, I discussed the simplest Availability Group architecture, with only a single site. In this post I will expand upon the same architecture, adding in a second site to achieve more than just high-availability. Cross sub-net availability group In the architecture...
Microsoft R Server, or Revolution R Enterprise (RRE) as it is formally known for now, is basically a platform for advanced analytics designed to tackle big data statistics, predictive modeling, and machine-learning capabilities. The open source R is limited in capacity as it is “single threaded and memory bound.” Microsoft R Server comes in handy if you need to scale and speed up your R applications by distributing massive data and computation on hundreds of nodes.
The architecture of Microsoft R Server includes the following underlying technologies which make it capable of handling massive amount of data and advanced analytics: ScaleR, DistributedR, and ConnectR. Read more about its capabilities and architecture here.
The Microsoft R Server capabilities will also be available in SQL Server 2016 through R Services.
It is available in the following flavors (source):
Hadoop—Scale your analysis transparently by distributing work across nodes without complex programming
Teradata database—Run advanced analytics in-database for seamless data analysis
SUSE Linux—Enable advanced analytics while making the most of your open-source investments
Red Hat—Bring predictive and prescriptive analytics power to your Red Hat environments
Windows—R Server for Windows will ship as R Services in SQL Server 2016 currently available as a Community Technology Preview (CTP)
The Microsoft R Server Developer Edition is available for download on MSDN. Here’s how to install it.
Install Prerequisite
Download and install Microsoft R Open (MRO) which is an “enhanced distribution of R from Microsoft.” The R engine version as of this writing is 3.2.2 released on January 1, 2016. Here’s the download site: https://mran.revolutionanalytics.com/download/mro-for-mrs/
You might have noticed the Important!flag in the Microsoft R Open download page that says “If you choose not to write to the registry keys during the installation of MRO for RRE, then you may be missing some functionality.”
So make sure to tick the checkbox on the last page of the installation wizard:
Complete the installation. This R distribution from Microsoft comes with a GUI called, intuitively, Rgui. You might be more familiar with the popular RStudio. Other popular R gui’s are Deducer and R Commander.
Execute the installation file Revolution-R-Enterprise-8.0.0-Windows.exe. As of this writing, this version/build is the Revolution Enterprise 8.0.0 (build 310). The installer will check for prerequisites on your machine.
I’m installing this on a fresh install of Windows Server 2012 R2 (VM on Hyper-V). You might have different items in the prerequisite list. Please take note, though, that the wizard cannot install the .Net Framework 3.5 SP1. Add this feature through the Server Manager.
Once all the prerequisites are installed successfully, the Revolution R Enterprise 8.0.0 Setup Wizard starts. Click next:
Recently I was working on a clients file server cluster and while doing some troubleshooting with Microsoft Support one of Image may be NSFW. Clik here to view.the clustered disks wouldn’t respond correctly. Now this file server cluster is setup in Azure so it is using SIOS Data Keeper to replicate the data between the nodes of the cluster.
In this configuration the cluster has two nodes FILESERVER01a and FILESERVER01b. The cluster is named FILESERVER01 and the name that users access files through is FILESERVER01V01. The top three drives were working exactly as expected, but the last one wasn’t working at all. Nothing could talk to it, nothing could manage it.
Thanks to Dave Bermingham (Clustering MVP, SIOS Employee and all around good guy) we found a forum thread that talked about this same problem and that the root cause was that the pool was registered as a cluster object within Failover Cluster manager.
Once I went into the failover cluster admin and remove the failed object for that pool I could attach the virtual disk again. Then I just needed to configure the disks to automatically attach on reboot. That’s easy enough to fix with a little PowerShell.
Then into computer management to bring the disk online (or reboot, but this is easier). Then resetup the SIOS software to replicate and away the data went.
Thankfully it’s fixed, and I can get back to the problem at hand of figuring out the EFS problem on the cluster.
As many people will point out, you can’t depend on the order of results without using the ORDER BY clause. So it’s easy to say “Simple! Don’t write code that expects unsorted data to be sorted”. But it’s very difficult to be careful everywhere all the time.
Remember that this is an application problem and is not a SQL problem. We only get into trouble when applications (or people) expect results to be sorted when they’re not. So unless you have a tiny application, or a huge amount of discipline, it’s likely that there is some part of your application that assumes sorted results when it shouldn’t.
Here’s a method I used that attempts to identify such areas, exposing those assumptions. It involves reversing indexes.
Image may be NSFW. Clik here to view.
If you don’t ask for results to be ordered they may still appear to be ordered. SQL Server will return results in a way that’s convenient and this is often in some index order. So if the indexes are reversed, then the idea is that what’s convenient for SQL Server will be reversed.
Image may be NSFW. Clik here to view.
Which results are ordered on purpose and which are ordered by luck?
It’s impossible to tell. But after the indexes are reversed:
Image may be NSFW. Clik here to view.
It’s now apparent.
Reverse the Indexes On A Dev Box
First use this powershell script to generate some SQL. It’s a script adapted from a Stackoverflow answer by Ben Thul “How to script primary key constraints”
Open up the create_indexes.sql script in an editor and swap ASC for DESC and vice versa
Create the reversed indexes
Recreate the foreign keys
That’s it! Now unsorted results will be returned in a format convenient to SQL Server which should be opposite to the original order.
Test
Remember how these ORDER BY assumptions are human or application problems? It’s time to bring them into this process. Test your applications/reports manually, or if you’re fortunate enough to have them, run your automated tests.
I’m one of the fortunate ones. I have access to a suite of automated tests that includes thousands of integration tests. In my case, roughly one percent of them failed after this experiment. Colleagues reactions were varied. They ranged from “That many?” to “That few?”
This experiment cannot identify all ordering assumptions, but it has a good chance at identifying many.
Fix
First let me give some advice on how not to fix this. Don’t begin by indiscriminately sprinkling ORDER BY clauses throughout all your queries. I found the best approach is to handle each problem on a case-by-case basis.
Here are some approaches:
Fix the test For automated tests, sometimes the test itself assumed an order. This is an easy case to deal with.
And don’t forget to double-check the report or UI element that uses the same query. There’s a good chance the UI is making the same assumption as the test.
Order results in the app If you’re using C#, try using Linq’s Enumerable.OrderBy. And if you’re using some other language or reporting framework, you should be able to sort there too.
Order in SQL If necessary order your results using SQL with the ORDER BY clause.
Happy ordering!
Image may be NSFW. Clik here to view.Image may be NSFW. Clik here to view.
I have a moderately popular blog. In part because I syndicate but largely (in my opinion) because I write a lot of posts (twice a week for > 3 years). Over 340 of them in fact. Because of this a friend asked me what I do if I write a blog and then discover that someone else wrote about the same subject, but did it better?
Since I’ve heard this question in a few different forms I thought I’d answer it.
Answer: It doesn’t matter in the slightest.
Seriously, what different does it make? With the number of bloggers out there it’s highly unlikely that I’m going to write about a subject that no one else has or will. It gets even worse when you throw in answers to questions on various forums. The idea is to put my own spin on it. When I describe something in my way it may resonate better(or worse) than someone else’s take. Also just because someone else wrote about it doesn’t mean that you read their version. And the people who read the other versions won’t necessarily see mine.
Just for proof I took 4 random blog entries and did a google search for other blogs/forums/etc on the same subject. Here’s what I came up with.
This is one of those rare cases where I think I was actually one of the first one’s to write about this. Lots of people writing about impersonation but I didn’t see anyone mention using TRUSTWORTHY to get server level permissions.
Hopefully I’ve made my point. It doesn’t matter if you write about the same subject as anyone else. As long as you aren’t plagiarizing someone else go for it!
One of the advantages Azure SQL Database has over on-prem SQL Server is the ease in which it can scale. I’ll discuss the various options for horizontal scaling, vertical scaling, and other similar features.
Horizontal scaling refers to adding or removing databases in order to adjust capacity or overall performance. This is also called “scaling out”. Sharding, in which data is partitioned across a collection of identically structured databases, is a common way to implement horizontal scaling.
Vertical scaling refers to increasing or decreasing the performance level of an individual database—this is also known as “scaling up.”
Elastic Database features enables you to use the virtually unlimited database resources of Azure SQL Database to create solutions for transactional workloads, and especially Software as a Service (SaaS) applications. Elastic Database features are composed of the following:
Elastic Database Pool: A pool is a collection of databases to which you can add or remove databases at any time. The databases in the pool share a fixed amount of resources (known as database throughput units, or DTUs). You pay a fixed price for the resources, which enables you to easily calculate costs while managing performance. This is vertical scaling. See Tame explosive growth in SQL databases by using elastic database pools to share resources
Another feature is called Stretch Databases, to let your on-prem SQL Server database hold just the core data, with old/cold data that continues to grow sidelined transparently in Azure SQL Database. This is a feature only available in SQL Server 2016. See Stretch Database.
Its been a busy start to the year at gethynellis.com. I have been involved in a Big Data training courses in Alexandria - a suberb of DC, followed by the same course running again in London a week later. This was followed by a SQL Server 2012 skills upgrade course in New York. At the start of this week I had a meeting in Washingon DC on Monday followed by a 2 day TSQL training course for a client in Basel Wednesday and Thursday. Its now Friday, I’m feeling a bit like this
I’m not complaining though, they were very productive and enjoyable trips and the jet lag fortunately doesn’t last too long.
I’m going to be teaching Learning Tree’s Developing SQL Queries for SQL Course in April (19th – 22nd April) if you would like to joing me follow the link to enrol. And if you have any questions please let me know


 Image may be NSFW.
 Image may be NSFW.
 Image may be NSFW.
 Image may be NSFW.
 Image may be NSFW.
 Image may be NSFW.
 Image may be NSFW.